Statistics (pictograms, bar charts & line graphs): Wildlife Survey
The Problem
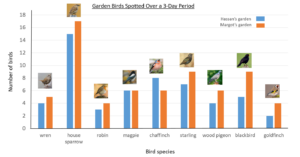
Hassan and Margot loved birdwatching so decided to take part in the RSPB’s Big Garden Birdwatch. One weekend, they got together and constructed a bar chart to represent their findings (shown opposite). Once their bar chart was finished, they had a long discussion about what it showed. During the discussion, they made a number of statements.
Hassan’s statements:
- “We spotted the same number of magpies.”
- “I spotted five fewer blackbirds in my garden than in Margot’s garden.”
- “Of all the birds spotted in both gardens, the starling was spotted the most number of times after the house sparrow.”
Margot’s Statements:
- “The number of wrens and robins spotted in Hassan’s garden was equal to the number of magpies spotted in my garden.”
- “Nine more birds were spotted in Hassan’s garden than in my garden.”
- “One eleventh of all the birds that I spotted were wood pigeons.”
Discuss with a partner which of the above statements you agree with. Can you explain your reasoning?
Did you know?
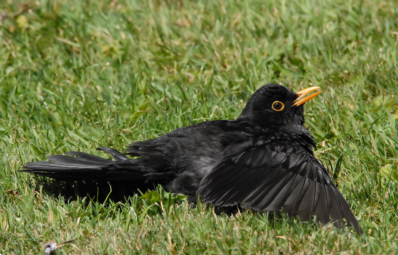
Blackbirds love to sunbathe! They can often be seen on the ground with their wings spread apart.
Visualising the Problem and Getting Started
Familiarise yourself with the bar chart by answering the following questions:
- What colour are the bars that show the bird species that visited Margot’s garden?
- How many different species of bird were spotted in the two gardens?