Statistics (pictograms, bar charts & line graphs): Sunflower
Further Challenges
- Can you use the TAIL checklist to improve your sunflower growth line graph?
T = Does your line graph have a title?
A = Are your axes drawn with a ruler?
I = Do the scales on each axis increase by
regular/equal intervals?
L = Have you labelled each axis?
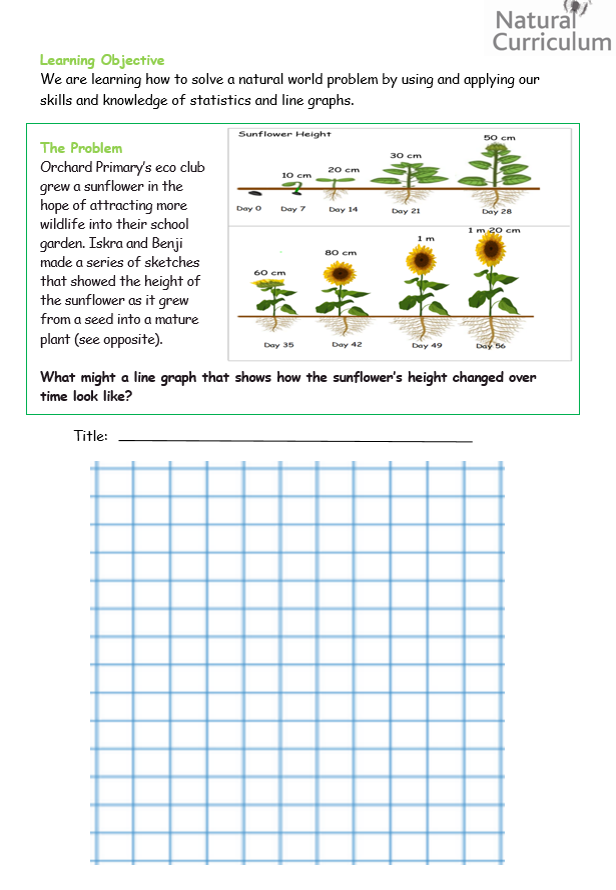
- From your line graph, can you calculate the approximate height of the sunflower on days 24 and 45?
- Desert Heat is a fabulous statistics lesson on the Natural Curriculum website. You will need to use and apply your knowledge and understanding of both line graphs and bar charts to read and interpret a climate graph.

Related Clip
Top tips for growing a sunflower.
Credit: BBC Teach