Statistics (pictograms, bar charts & line graphs): Sunflower
The Problem
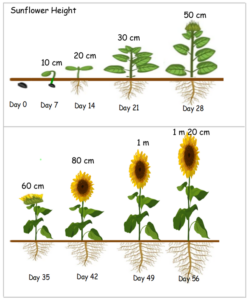
Orchard Primary’s eco club grew a sunflower in the hope of attracting more wildlife into their school garden. Iskra and Benji made a series of sketches that showed the height of the sunflower as it grew from a seed into a mature plant (see opposite).
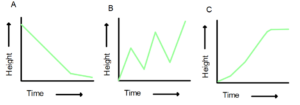
What might a line graph that shows how the sunflower’s height changed over time look like?
Did you know?
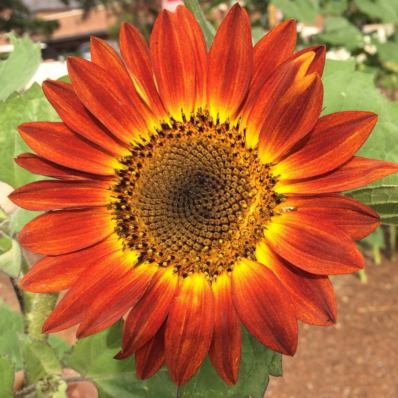
Although sunflowers are commonly bright yellow, some are orange, maroon, red and even chocolate brown!
Visualising the Problem and Getting Started
Which of the following ‘quick sketches’ do you think your line graph will look like? How do you know?