KS2 Maths Lessons: Statistics (pictograms, bar charts & line graphs)
The Maths Bit!
In this exciting lesson, we will be learning how to present and interpret bar charts. We will be using the information that is presented in a bar chart to solve a variety of number problems. At the same time, we will be learning about woodlands and how they are such wonderful habitats for so many different plant and animal species.
A bar chart is a simple and effective way to display information that uses rectangular bars of different heights.
There is a horizontal line (x axis) that shows you what is being investigated and a vertical line (y axis)with numbers on it.
Prior Learning: To interpret and construct bar charts, pictograms, tally charts and tables.
Did you know?
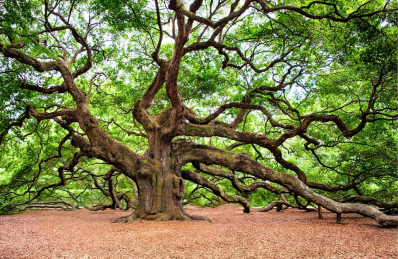
Oak trees support more life than any other native tree species in the UK. They feed various living creatures with their leaves and acorns. Some ancient oak trees have been growing for more than 1,000 years!
Whiteboard Challenges
Have you ever hugged a tree? Many people believe that hugging a tree can reduce stress and make you feel calm.
This bar chart shows the different broadleaved trees and the number of times that a man called Willow hugged them!
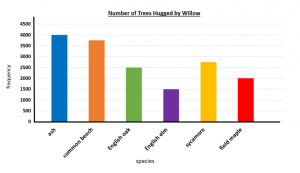
1) Which type of tree did Willow hug the most?
2) How many more ash trees than English oak trees did Willow hug?
2) What was the total number of ash, common beech and English oak trees hugged by Willow?