Statistics (pictograms, bar charts & line graphs): Remarkable Rock Pool
Further Challenges
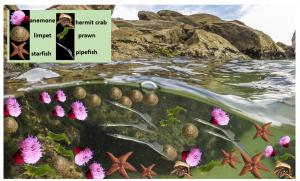
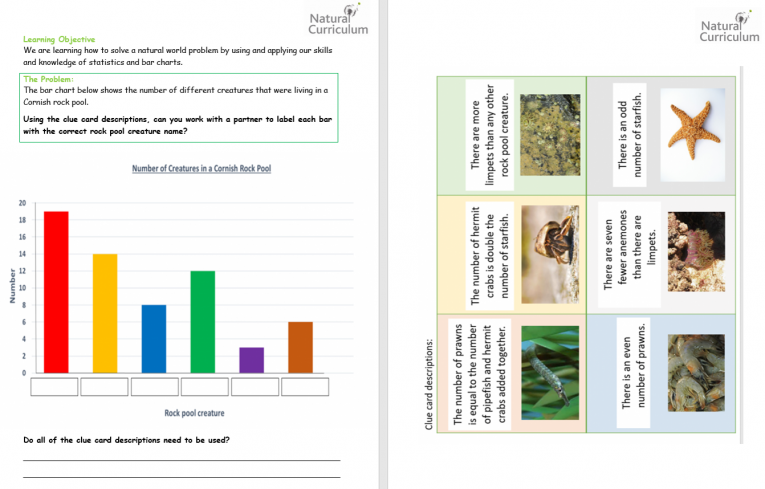
- Construct a bar chart that shows the numbers of different cretaures that are shown in the rock pool below. Can you use your bar chart to write some comparative statements about the different number of creatures in the rock pool?

- Try the following nature-themed statistics lessons from the Natural Curriculum:
– Bar charts – owls
– Bar charts – pond life
– Pictograms – seed dispersal
– Pictograms – fossils

Related Clip
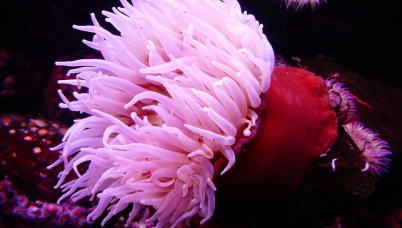
Sea anemones fight for the best place in a rock pool.
Credit: BBC Four – The Secret Life of Rock Pools

 Sign in
