Statistics (pictograms, bar charts & line graphs): Leopard and Tiger
The Problem
An Amur leopard has set off from a mountain cave to cross its territory. It is travelling at a constant 5 miles per hour. After an hour of travelling, it rests for an hour. It continues on in this manner.
How far will the leopard have travelled after eight hours?
Can you create a table to show the distance travelled by the leopard in this time?
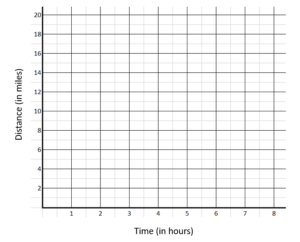
Can you use your table to construct a line graph that shows the distance travelled by the leopard?

The Amur leopard (Panthera pardus orientalis) can run at speeds of up to 37 miles per hour. They can’t maintain this for very long though.
Visualising the Problem and Getting Started
Discuss with a talk partner how you might complete the line graph below to show how far the leopard had travelled after 8 hours.


 Sign in