Statistics (pictograms, bar charts & line graphs): Desert Heat
Further Challenges
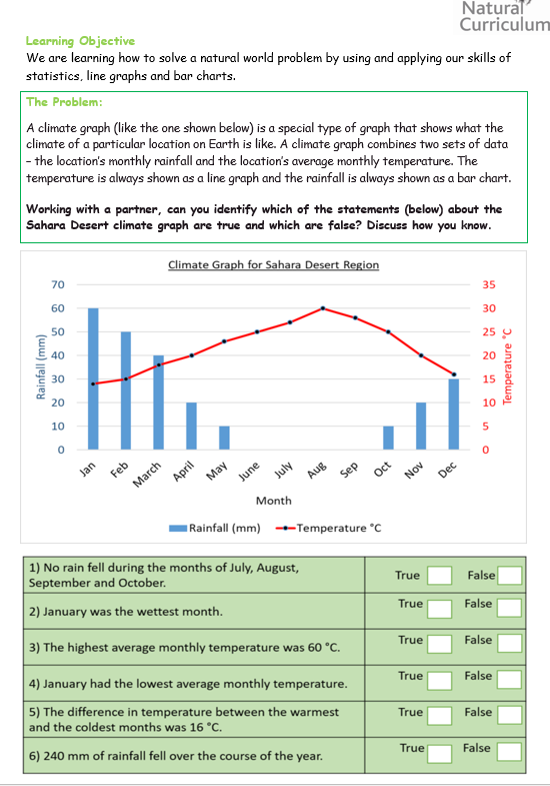
- Can you write 3 further statements about the Sahara Desert climate graph? Will your statements be true or false? Ask a classmate to decide!
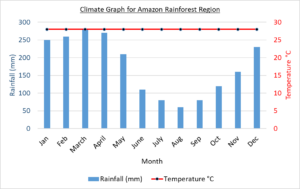
- How does the Amazon Rainforest climate graph (below) compare to the Sahara Desert climate graph. What is similar? What is different?
- Wildlife Survey is a fabulous statistics lesson on the Natural Curriculum website that will encourage you to work with a partner and share your knowledge and understanding of a bar chart.

Related Clip
Incredible footage of a sand storm in the Sahara Desert.
Credit: BBC One – Planet Earth